

Products
Optimal Flight
Self-review of handling technique from your own flight data
After every trip the pilot sees their own measurements, where they sit against the limits, their own history and comparable conditions. The system shows repetition and trends; the conclusion about handling technique stays with the pilot.
The airline's problem
Most day-to-day correction of handling technique happens between the formal debriefs. For that a pilot needs regular access to the data from their own flights.
In practice the results of flight data processing stay inside a specialist department and come back to the pilot after a particular occurrence. Such a signal arrives rarely and covers mostly the extreme values.
Between those cases lies a large body of ordinary flights. It carries repetition, settled habits and movement in the numbers, visible well before any of it becomes a matter for review.
What the system does
Optimal Flight returns the results of flight data processing to the pilot.
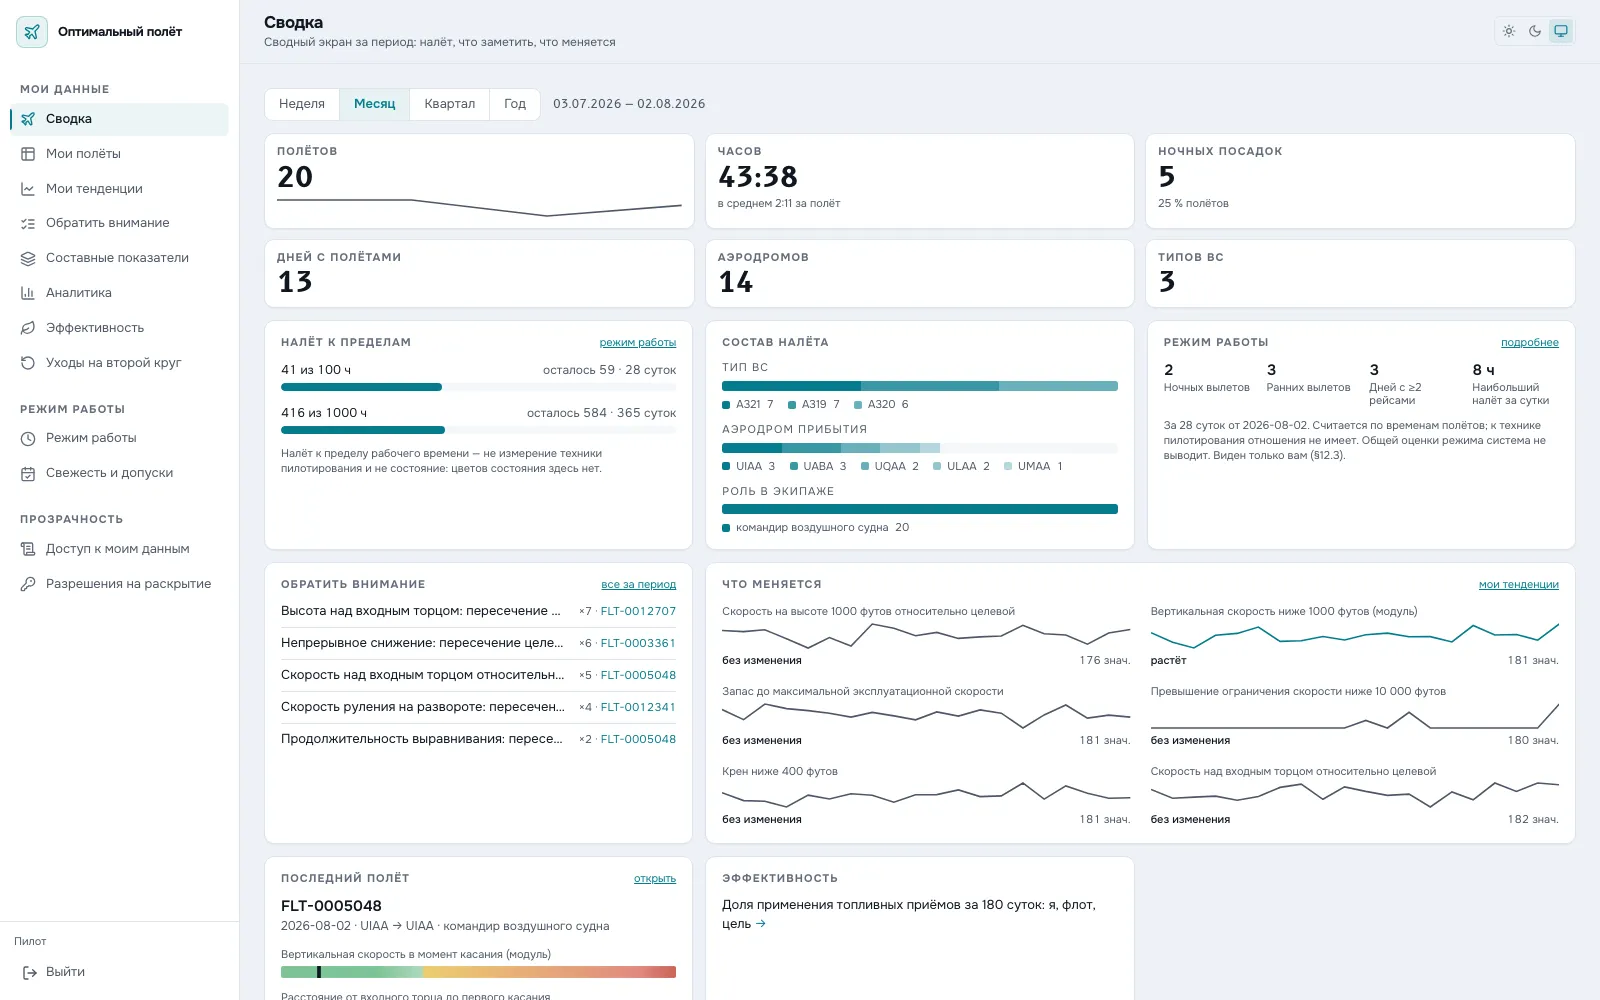
After every trip they see their own measurements, where each sits against the established limits, the history of that measurement and the distribution across comparable conditions — the same aircraft type and the same aerodrome.
Confirmed trends and repeated cases are shown separately. The «Worth noting» screen gathers repetition by measurement over two years.
The system supplies material for the pilot’s own review. It draws no conclusion about handling technique on their behalf.
A personal result is available to the pilot alone. Departments receive de-identified distributions for methodological work. This is the condition under which self-review works at all: under observation a person defends themselves instead of looking into the matter.
How it works
The path from source data to a specialist's decision
-
Data sources
Measurements from the flight data processing system and crew composition, tied to the trip and to the seat in the crew.
-
Processing
Position against the limits, the pilot's own history, the distribution across comparable conditions and a trend test.
-
Result
The pilot reviews each measurement themselves; repeated cases and confirmed trends are gathered on separate screens.
-
Specialist's decision
The conclusion is the pilot's own. Departments receive de-identified distributions by unit, aircraft type and aerodrome.
Key capabilities
- Review of every flight and every measurement: position against the limits, the pilot’s own history and a comparable sample listing the conditions applied.
- Trends, with confirmed results held apart from series that carry no conclusion yet.
- The «Worth noting» screen for repeated measurements over two years; an unusually high firing rate points to a limit that may need revision.
- Composite indicators for approach and landing — the 1000 ft and 500 ft gates, energy state, flare and touchdown — shown by composition, with no single score.
- The share of fuel-saving techniques applied, with month-by-month movement and the grounds behind the target.
Video overview
Interface
Data and integrations
The system takes measurements already computed, together with crew composition. Deriving those measurements from raw flight parameters remains a function of the operator’s flight data processing system.
Personal results and de-identified distributions are stored apart. The table linking pilot, trip and crew seat is reachable only through a dedicated function that takes its subject from the confirmed session.
Disclosure of a personal result requires a permission from the trusted intermediary, limited in time and in scope.
Methodology and regulatory basis
The state of a measurement follows a priority of limits: an operating limitation outranks a procedural limit, and a procedural limit outranks a target.
A statistical limit sits outside that order and receives no colour status. It shows how rare a value is and says nothing in itself about danger.
A trend is assessed by the Mann–Kendall test with a correction for ties and by a Theil–Sen estimate. For short series the exact probability is computed by full enumeration.
A trend is confirmed only when three conditions hold at once: series length, statistical significance and the size of the change.
Where those conditions fail, the system states no conclusion. «There is no trend» would be a claim the calculation never made.
Where the system stops
Conclusions about handling technique are drawn by the pilot. On screen this is held in place by the wording: «the trend belongs to the measurement, not to you», «the share belongs to the technique, not to you».
There is no summary score, rating or «outside the frame» counter. Such figures would let people be compared with one another and would turn the system from self-review into personal ranking.
For the same reason the list of techniques is ordered as a reference and is never sorted by size of shortfall.
Three such indicators were written and then removed from the system: a fatigue index from 0 to 100, a general «outside the frame» counter and a boolean flag «deviations present» on a composite indicator. One bit differs from a score only in width.
What the airline gets
The pilot gains their own picture of their flying, refreshed after every trip. Repetition and movement can be examined before a single case becomes a matter for review.
Departments receive de-identified distributions by unit, aircraft type and aerodrome for methodological work.
For fuel-saving techniques the applicable share, the rate of use and its month-by-month movement are visible.